The Agentic Analyst: CTS Eventim
A Case Study in AI-Driven Equity Research

Disclaimer: This article is for informational and educational purposes only and serves as a demonstration of data analysis and AI workflows. It does not constitute financial advice, an investment recommendation, or a solicitation to buy or sell any securities
This post is a walkthrough of how I used AI tools, specifically Primer and Codex, to do the kind of analytical work that used to take weeks. I chose CTS Eventim as a case study because it has a live analytical debate, messy disclosure, and enough complexity to stress-test the tools properly. Nothing in this post is intended as a view on whether CTS Eventim shares are cheap, expensive, or fairly valued. I have no position and no intention of taking one.
What I set out to do
CTS Eventim’s share price has roughly halved, which raises an interesting analytical question: was the underlying business weakness broad-based or company-specific, and was it cyclical or structural?
That sounds simple, but it actually breaks into a few different questions.
Was Eventim weak because the overall live-events market weakened?
Was 2025 just a tough comparison year after a very strong 2024?
Or did something actually go wrong inside Eventim itself, whether on share, pricing, fill or mix?
In other words, this is a useful case study for testing whether AI tools can help an analyst distinguish between different explanations for a business slowdown, quickly and systematically.
Naturally, it’s no longer my job to generate investment ideas and I’m definitely outside of the loop but my view was that using Primer and other AI tools, I’d be able to build a clean view of underlying Ticketing organic growth, compare Eventim against the broader live-events market, and then see whether any of the data said something useful about what was happening into Q1 2026 in significantly less time that it would otherwise have taken me.
Sign up to Primer’s waitlist here
Where I’ve landed
If you don’t want to read the whole thing, my short answer is this:
I do not think the evidence supports a simple “the live-events market slowed, so Eventim slowed” explanation.
The broad market measures I built stayed much healthier than Eventim’s own activity proxies through 2025, especially in the middle of the year. So the data suggests the weakness was more Eventim-specific than market-wide.
I also do not think 2025 was purely a hard-comp story. Comparisons explain part of the slowdown, particularly in H1, but they do not explain all of it. Q3 2025 still looks like a genuinely weak patch in the data.
The data is most consistent with the problem sitting inside Eventim’s own economics rather than in raw event demand. In plain English, the likely candidates are some combination of share, pricing, fill, or mix, rather than simply “fewer events were happening”.
What the data does not resolve is whether that weakness was temporary or structural. The evidence is more consistent with a soft patch than a permanent impairment, but it is not strong enough to distinguish between those two explanations with any confidence. This is an observation about what the data shows, not a view on the stock.
Crucially, however, the underlying search data for Q1 2026 is interesting from a methodological standpoint. Germany Google Trends data suggests that Q1 organic growth may be running ahead of management’s guidance of ‘similar levels to last year’. While the empirical confidence interval is wide, it points above that guidance.
The Process
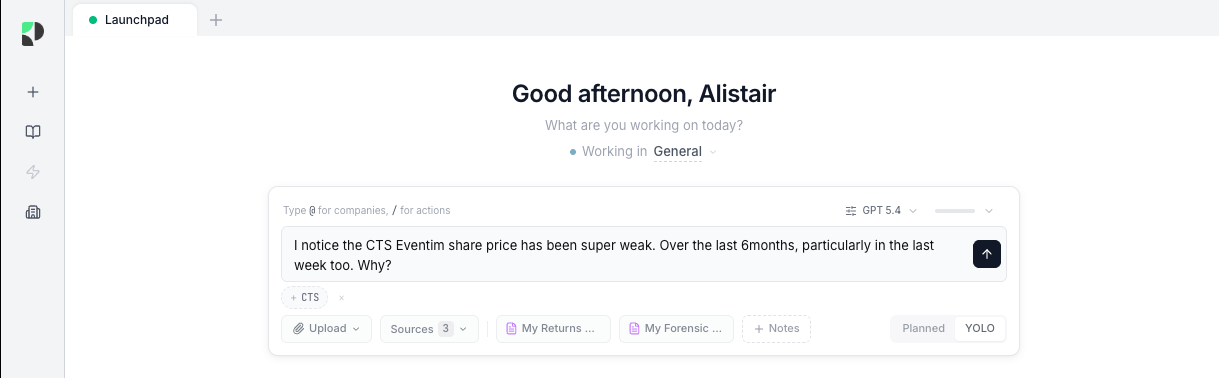
First things first was to try to get up to speed as quickly as possible and asking Primer what the drivers of the very poor share price performance over the last 6 months was.
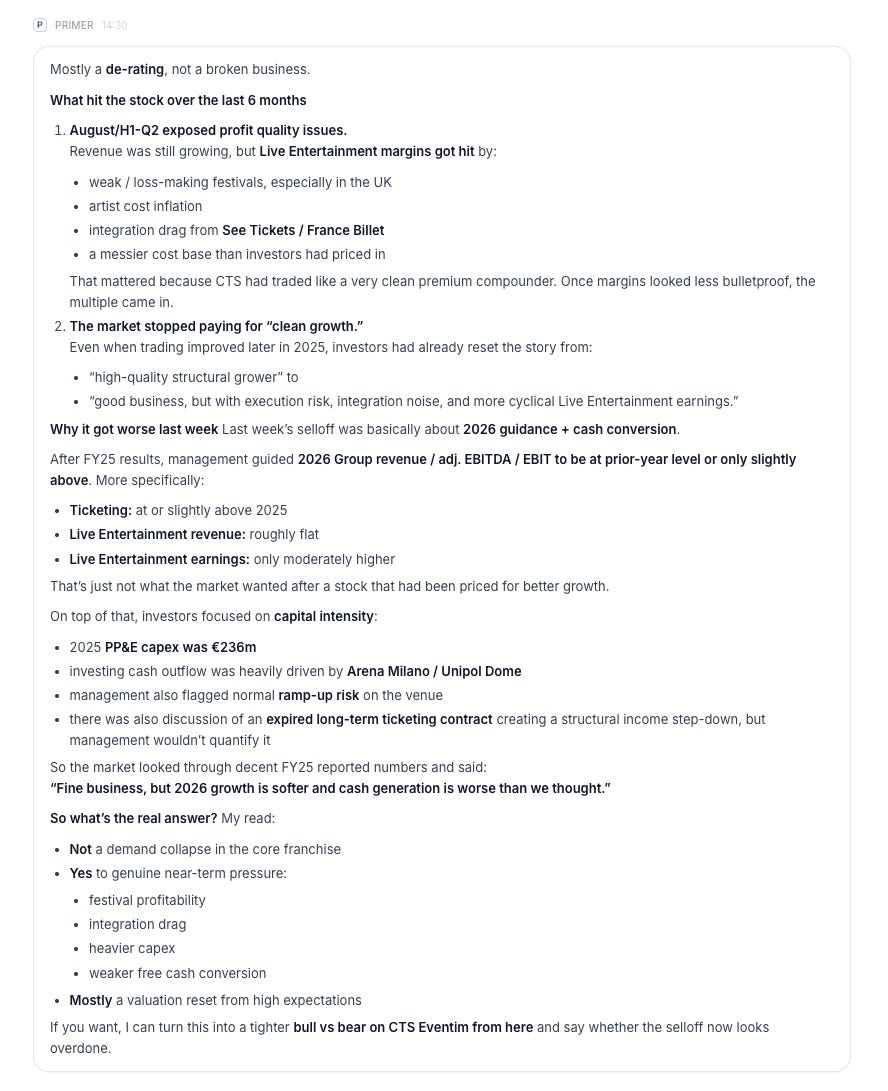
Quite a lot of Live Entertainment noise here, which I appreciate matters if it’s not consistent, but Ticketing is the real driver of the business economics. So the next step was to understand what was actually happening inside Ticketing rather than just stare at consolidated growth.
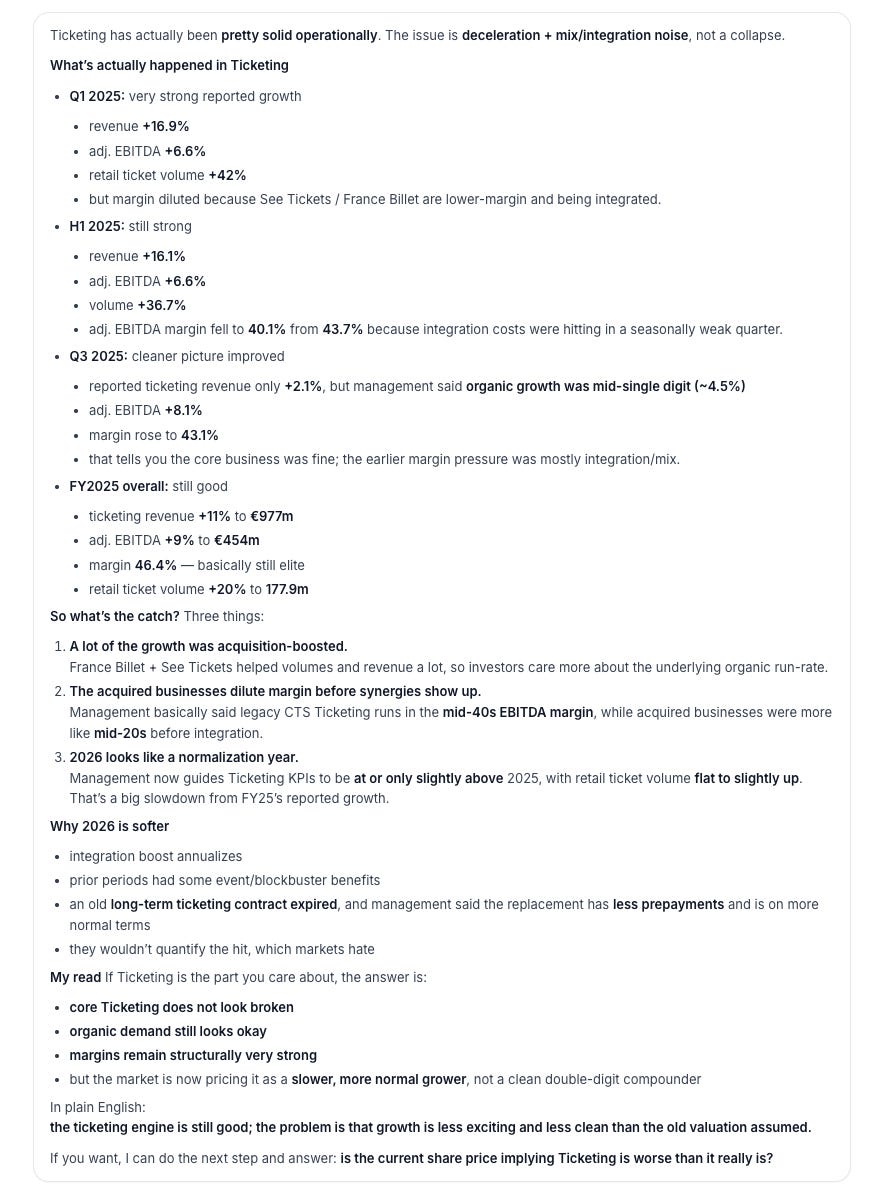
The agent picked up that a lot of recent growth was M&A-driven, and that those acquired businesses were lower-margin than the legacy ticketing engine. In other words, even before getting into the organic debate, the quality of the growth had already started to look different.
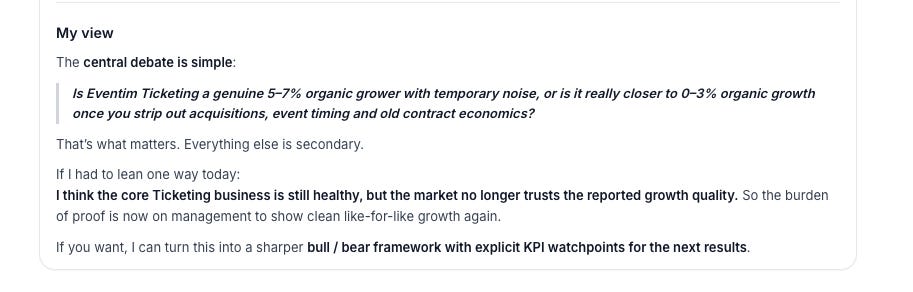
The next obvious step was to work out what the actual debate was. As expected, the key issue was whether underlying organic growth was really still mid-single digit, and whether the slowdown was structural, cyclical, or just Eventim-specific.
Full list of key debates here:
Is underlying organic growth actually still mid-single digit?
Was 2025 organic growth real, or helped by timing/blockbuster noise?
Is the long-term contract expiry a small nuisance or a real structural headwind?
Is Ticketing still taking share, or just digesting acquisitions?
Can new product levers actually accelerate organic growth?
As per the above screenshot from Primer, the key debate was around organic growth in ticketing. I now needed to understand how organic growth had actually trended in recent years, which required a bit of jiggery pokery because disclosure is not nearly as good as it could be.
“Could you build me a quarterly organic growth model for ticketing from 2021 to end of FY25. Historically disclosure has been poor so make sure you search through all docs to try to impute organic. Might be worth starting by pulling all the acquisitions they have made, assigning quarterly revenues and then working backwards from there”
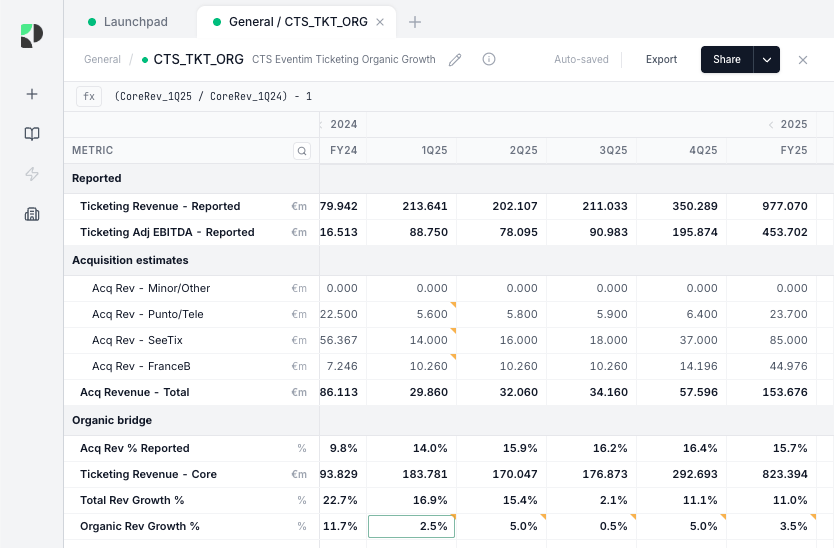
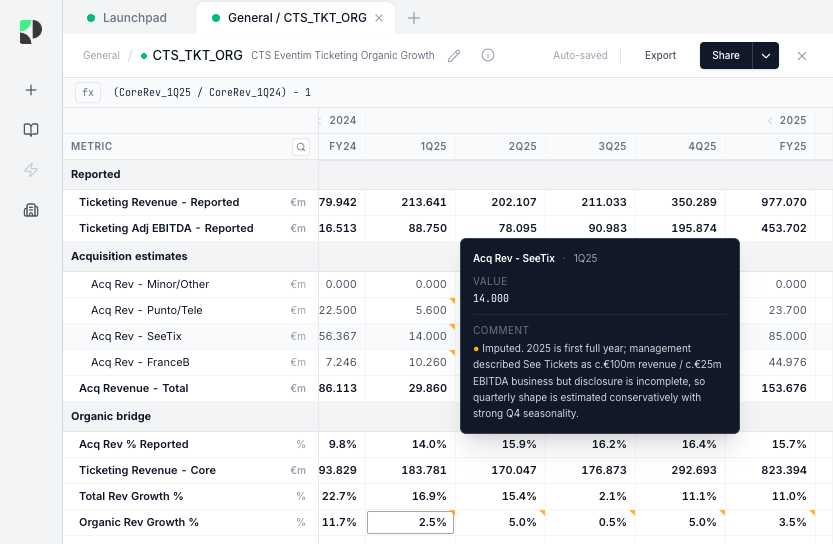
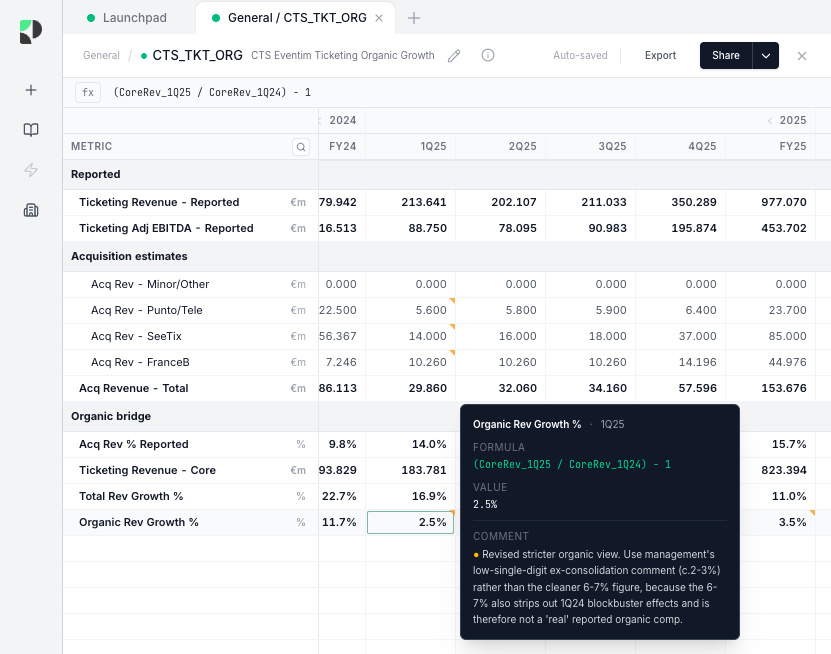
Key things to flag from Primer (see comment boxes):
The agent managed to identify the three material acquisitions and make sensible imputations to work out quarterly revenues.
It effectively discarded management’s adjusted organic commentary and gave me what felt like a more realistic figure.
The agent did a great job of imputing sensible organic growth numbers, something I know took me much longer than the 5 mins to do historically.
Now that I had a decent understanding that organic really had slowed from FY24 through FY25, the next step was to understand what management itself had actually said about the causes.
“Help me understand what management were saying about the organic slowdown in 2025. Pricing/volume/lost contracts?”
So really the follow-up question was straightforward: why did organic slow down for Eventim? To answer that, I needed some market-level event data and then some Eventim-specific event-volume data..
So the only thing to do was to set Codex off to find some good data sources:
”I want to build a dataset to understand how the number of concerts/events has evolved over the last 15 years in Europe. The reason being is that CTS eventim has seen a slowdown in organic growth recently and there’s an argument to suggest that we’re just seeing post covid normalisation for the sector. Plan this first and verify potential data sources before building”
The key design principle was simple: build a dataset that could answer whether Eventim slowed because the market slowed, or whether Eventim slowed even though the market was still healthy.
So the main choices were:
Separate the market from Eventim: we built one layer for the broader European venue market, one for Eventim’s own venues, and one for places where Eventim appears to be the ticketing partner.
Start with venues, not artists: counting events by venue made it much easier to compare countries, quarters, stadiums, and arenas.
Use different sources for different jobs: one source for historical event counts, official venue sites for upcoming schedules, and ticket links to see whether Eventim was involved.
Prioritize reliability over perfect coverage: if a source was weak or unclear, we kept it as “unknown” rather than forcing a bad answer.
Look at both yearly and quarterly trends: yearly data showed the long-term pattern, while quarterly data helped test whether the slowdown was really concentrated in late 2025.
Go beyond event counts: we knew early on that the real issue might be share, ticket prices, or fill rates, not just how many events happened.
Make it auditable: every important datapoint needed to be traceable back to a source page, a scrape, and a timestamp.
Build a representative panel: the aim was not just to track famous venues, but to build a broader sample across European markets, venue types, and Eventim exposure.
In plain English, the project was designed to answer three questions:
Was the overall live-events market slowing?
Was Eventim’s own venue footprint weaker than the market?
If Eventim was softer, was it because of share, pricing, or fill rather than fewer events?
I/Codex built three layers of data:
a broad European venue panel to measure the market
a narrow Eventim-owned venue panel to measure Eventim’s core estate
a broader Eventim-relevance layer to identify venues where Eventim appears to be the ticketing partner
The point was not to build a perfect dataset. It was to build something good enough to answer whether Eventim slowed because the market slowed, or whether Eventim slowed inside a still-healthy market. By the end of the exercise, the historical venue-event base covered 99 venues and 34,681 canonical events.
After quite a long time babysitting Codex, I felt I had something vaguely sensible to start using.
Data Analysis
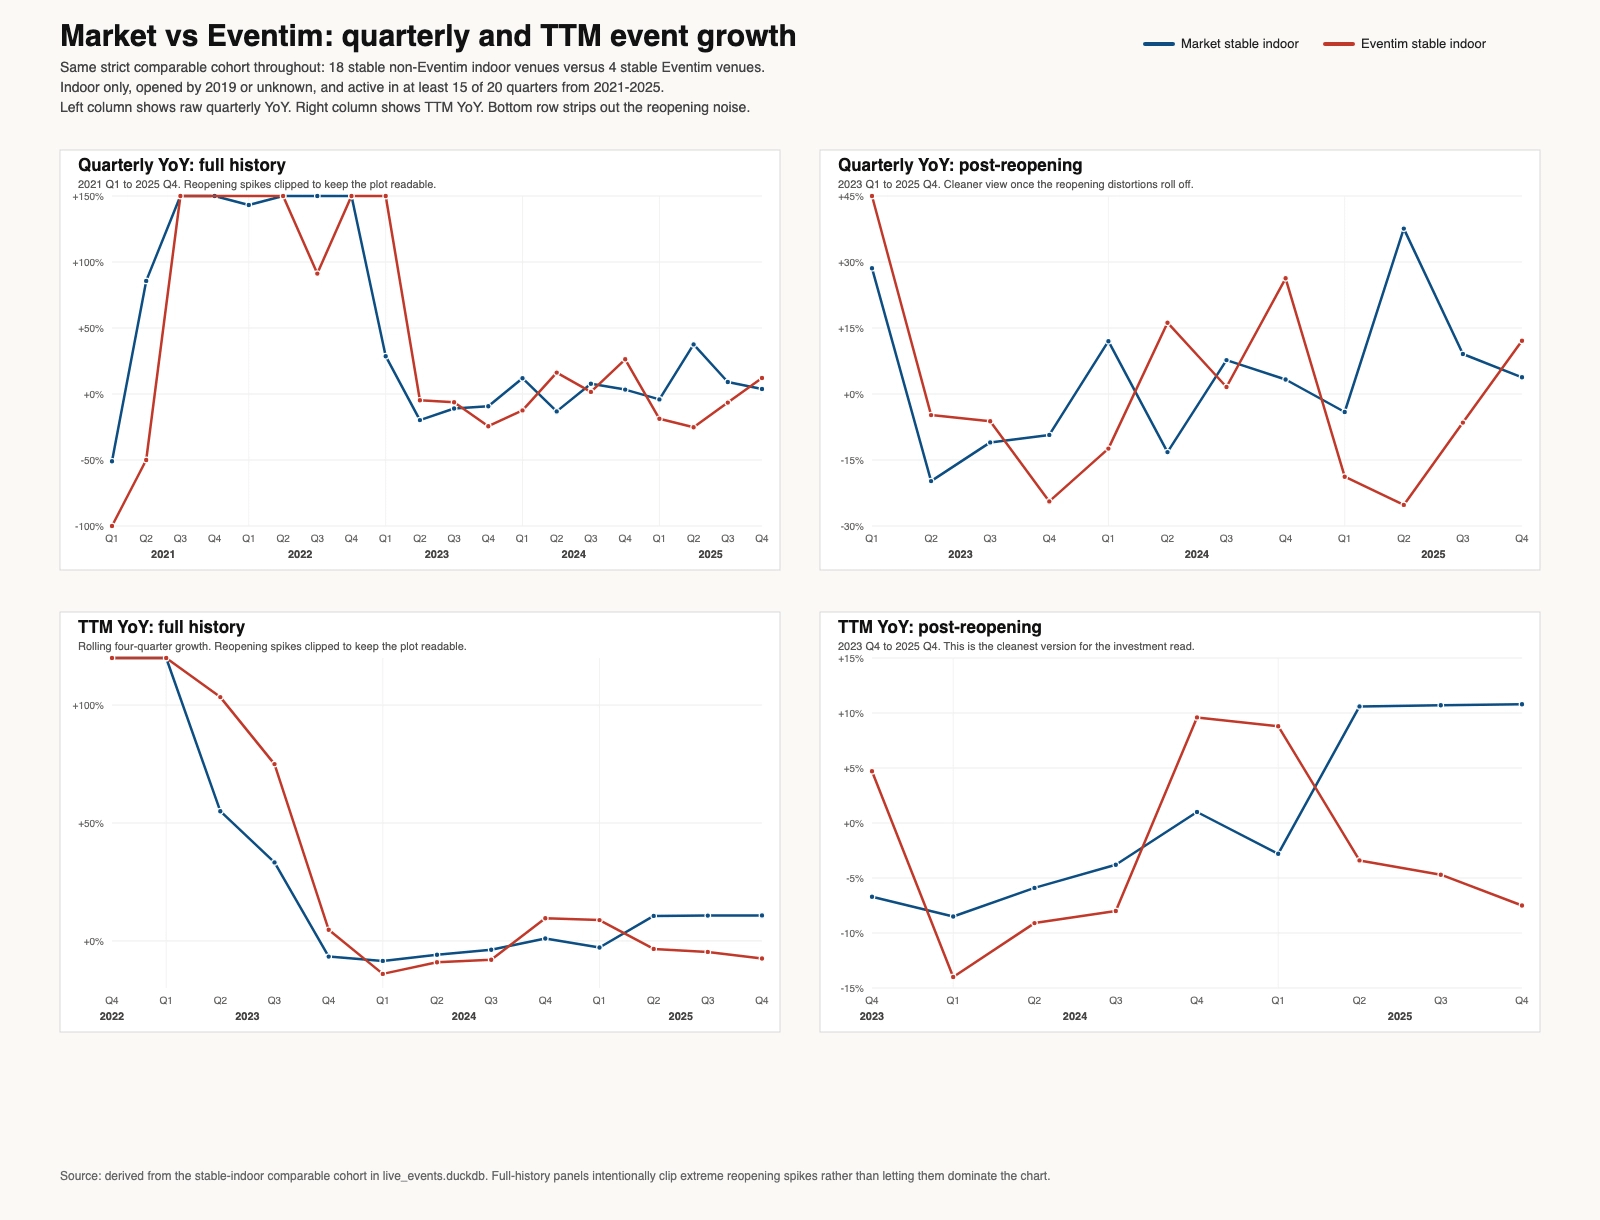
So the first thing I did was ask Codex to draw me a quarterly comparison of the market data versus the Eventim data. Quarterly was noisy, but on a trailing-twelve-month basis it did feel as though Eventim had broadly moved with the market until there was a clear bifurcation in 2025.
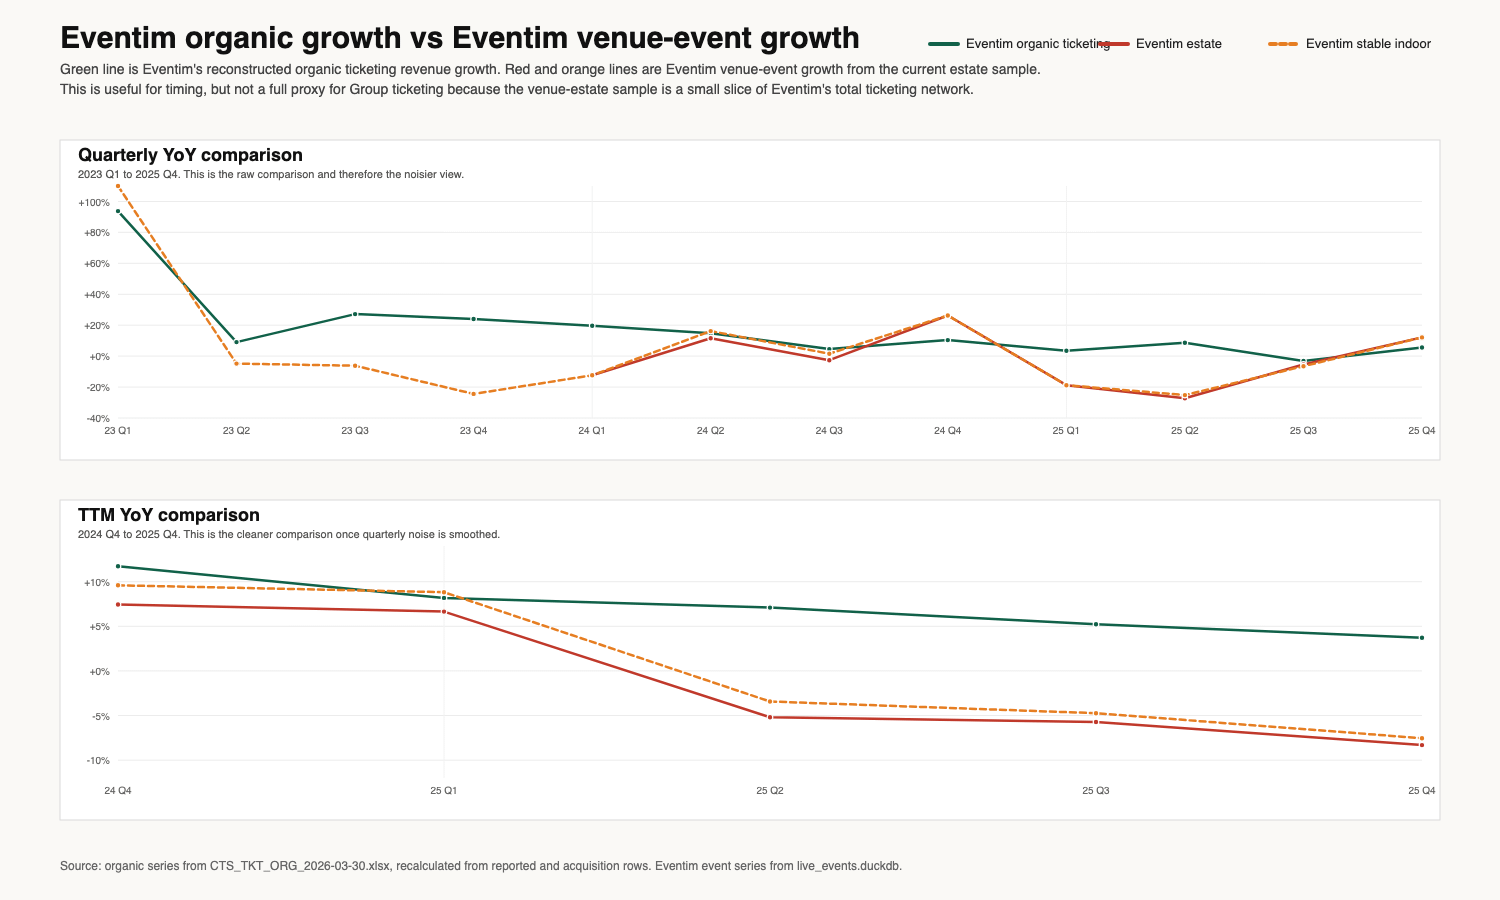
The thing I was worried about was that we were only using data from four venues for Eventim (their branded venues), which felt very small. The natural next step to understand whether this was even representative was therefore to compare the Eventim dataset against reported Eventim data.
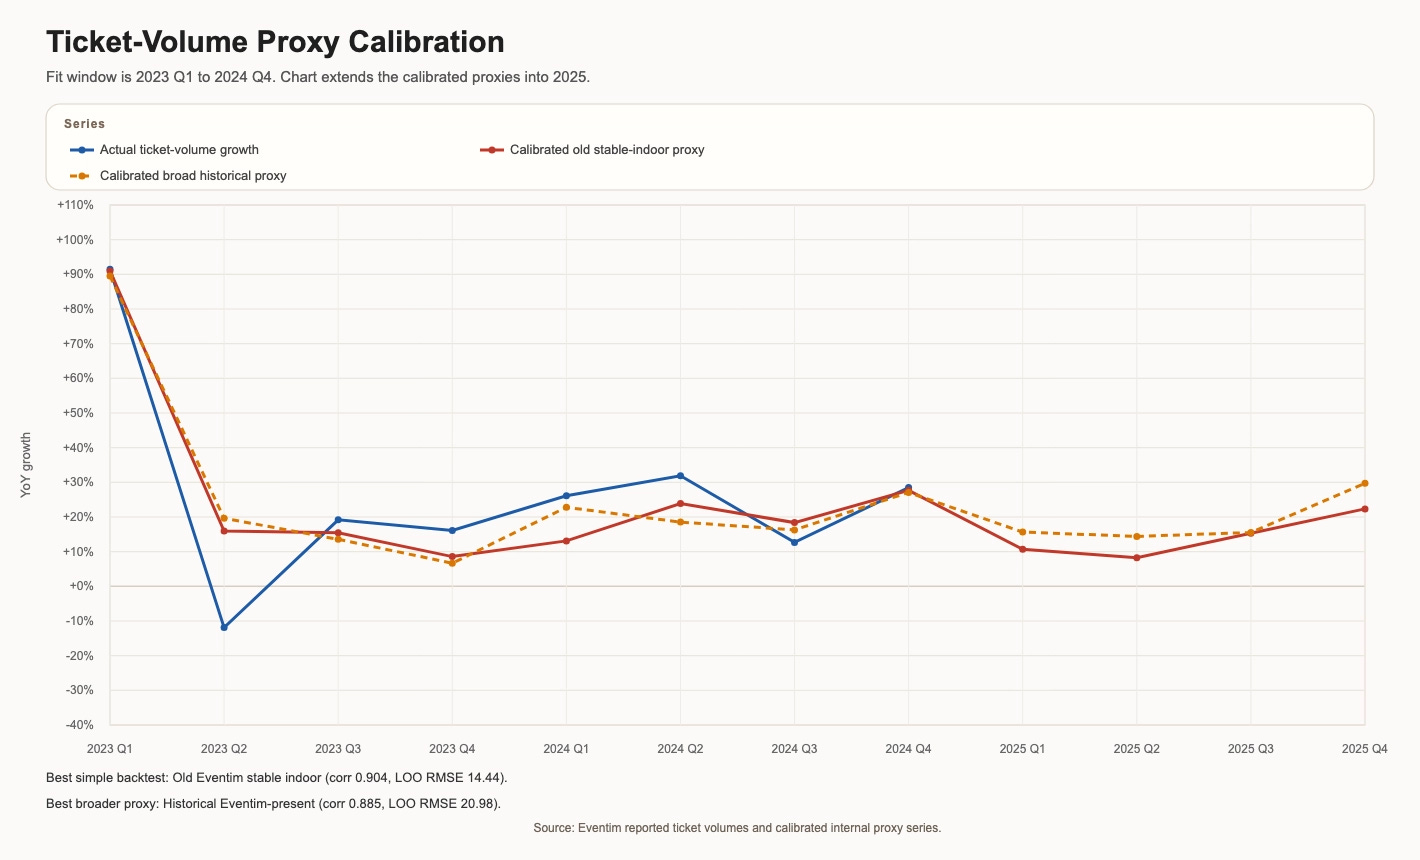
As you can see from the top chart above, it did not feel like a perfect relationship, although there was also a decent inflation / pricing tailwind through 2023. I remembered that Eventim used to disclose online ticket volumes, so I asked Codex to add those to the model so I could compare event activity with actual ticket-sale volume.
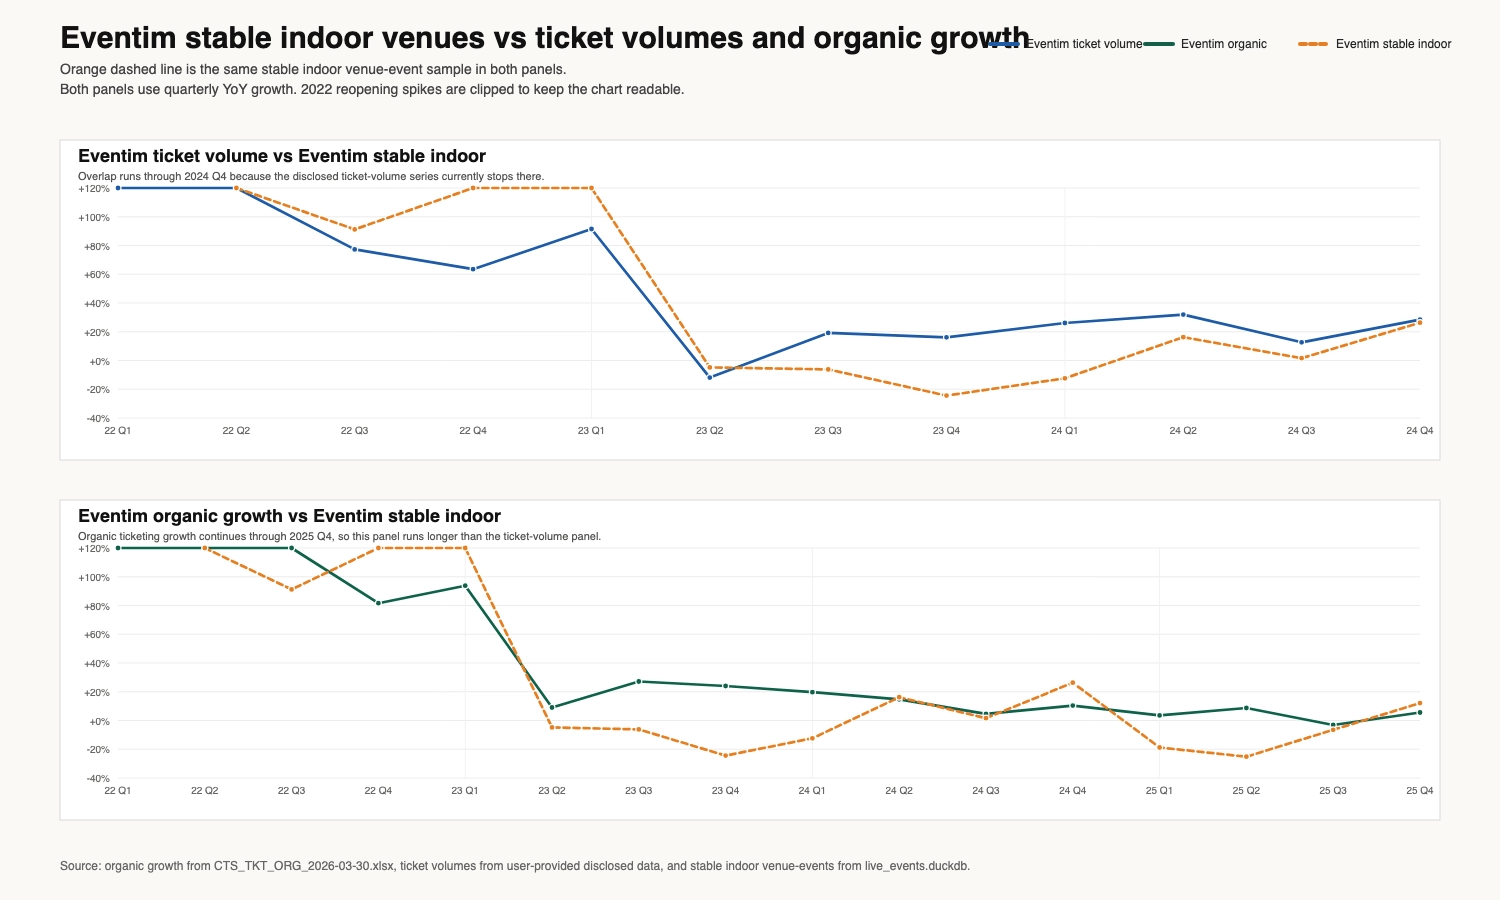
Now we are at least comparing event volume to ticket sale volume and I don’t hate the shape of the top chart but something happened in the Eventim stable indoor series in Q4 22 and Q1 2023 (maybe Q421 and Q122 YoY effect) which caused notable bifurcation. So I asked Codex to take a look:
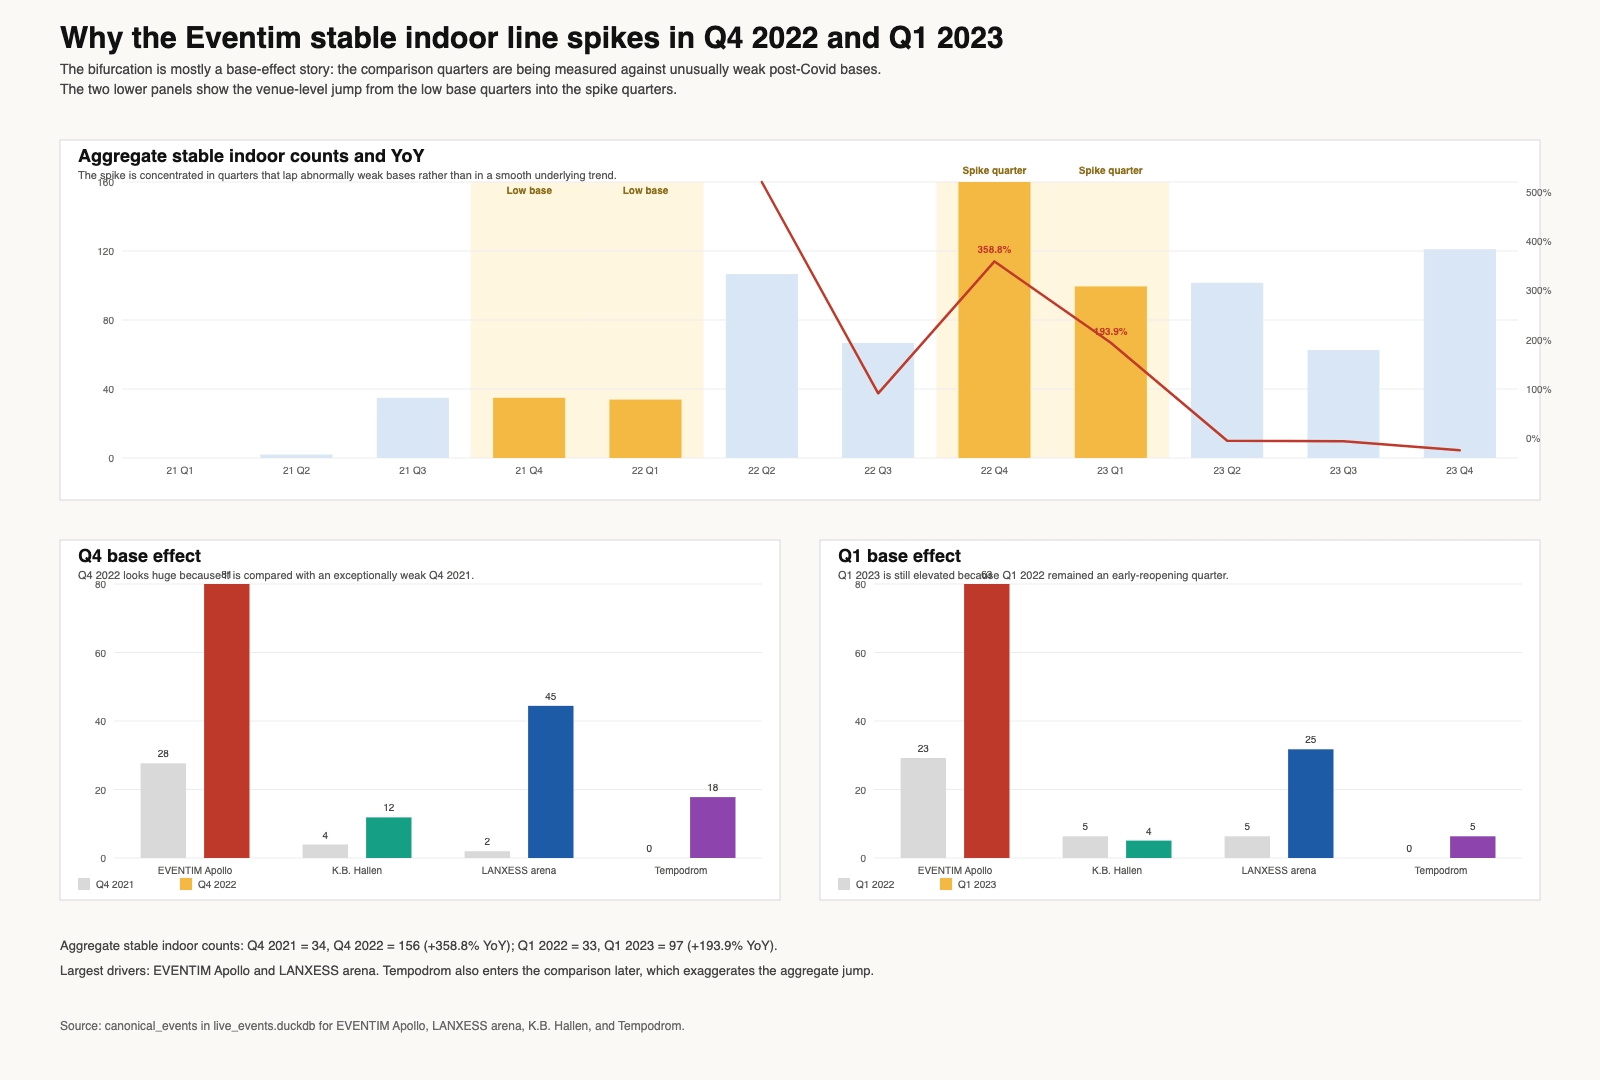
Basically, the Eventim venue series contains a very obvious reopening base effect. The stable indoor sample only includes four venues, and two comparison quarters, Q4 2021 and Q1 2022, were unusually weak as live events were still normalising after Covid. That created mechanically inflated YoY growth in Q4 2022 and Q1 2023, which is why the Eventim line briefly diverged so sharply from the rest of the series.
So the next step was to increase the sample size. The problem was that Eventim-owned / operated venues are not a huge list, and what I really needed was not just more venues, but more events which were ticketed by Eventim rather than simply taking place in buildings Eventim happened to own.
So this became less of a scraping problem and more of a measurement problem.
In an ideal world, I would have built a huge historical dataset of every event ticketed by Eventim across Europe and compared that directly to the company’s online ticket volumes. In reality, that is hard. Historical event pages disappear, seller links are not always preserved, and venue websites are inconsistent. So I took a more pragmatic route: build a broader historical “Eventim-present” dataset where possible, and then test whether it actually improved the fit to Eventim’s disclosed ticket-volume data.
That broader historical panel was definitely larger than the original four-venue series. In theory it should have been better. In practice it was only directionally useful. Once I benchmarked it properly against Eventim’s reported ticket-volume growth through Q4 2024, it still did not beat the old four-venue indoor series.
That was frustrating, but also quite revealing.
The best simple backtest to disclosed ticket-volume growth was still the original four-venue stable indoor proxy. It produced a quarterly correlation of 0.904 to ticket-volume growth through Q4 2024, versus 0.885 for the broader historical Eventim-present panel. More importantly, when I looked at out-of-sample-style error rather than just correlation, the four-venue series still came out ahead.
That does not mean four venues are somehow representative of Eventim’s entire business. In fact, I explicitly tested that. I ran the same ticket-volume fit against every possible four-venue combination from the venues where I had full 2023-2024 data. The current Eventim panel ranked 10th out of 126 possible combinations. In other words, it is a good proxy, but not a magical one. It behaves more like a useful cyclical barometer than a literal representation of Eventim’s whole ticketing footprint.
That left me in an awkward position. I had a four-venue proxy that was clearly useful, but clearly not representative. So the next step was to see whether I could build something broader that was more faithful to the real business without losing the fit to reported ticket volumes.
In theory, the broader historical Eventim panel should have solved that. In practice, it did not. Historical attribution is messy: event pages disappear, seller links are not always preserved, and venue websites are inconsistent. I managed to build a much broader “Eventim-present” historical panel, but once I benchmarked it against Eventim’s disclosed online ticket volumes through Q4 2024, it still did not beat the old four-venue indoor series.
That was frustrating, but it also told me something important. The problem was not just sample size. It suggested that raw event counts, even when broadened, still were not capturing the full economics of the business. Eventim’s ticketing growth is driven by more than just the number of events. It is also driven by share, pricing, fill and mix.
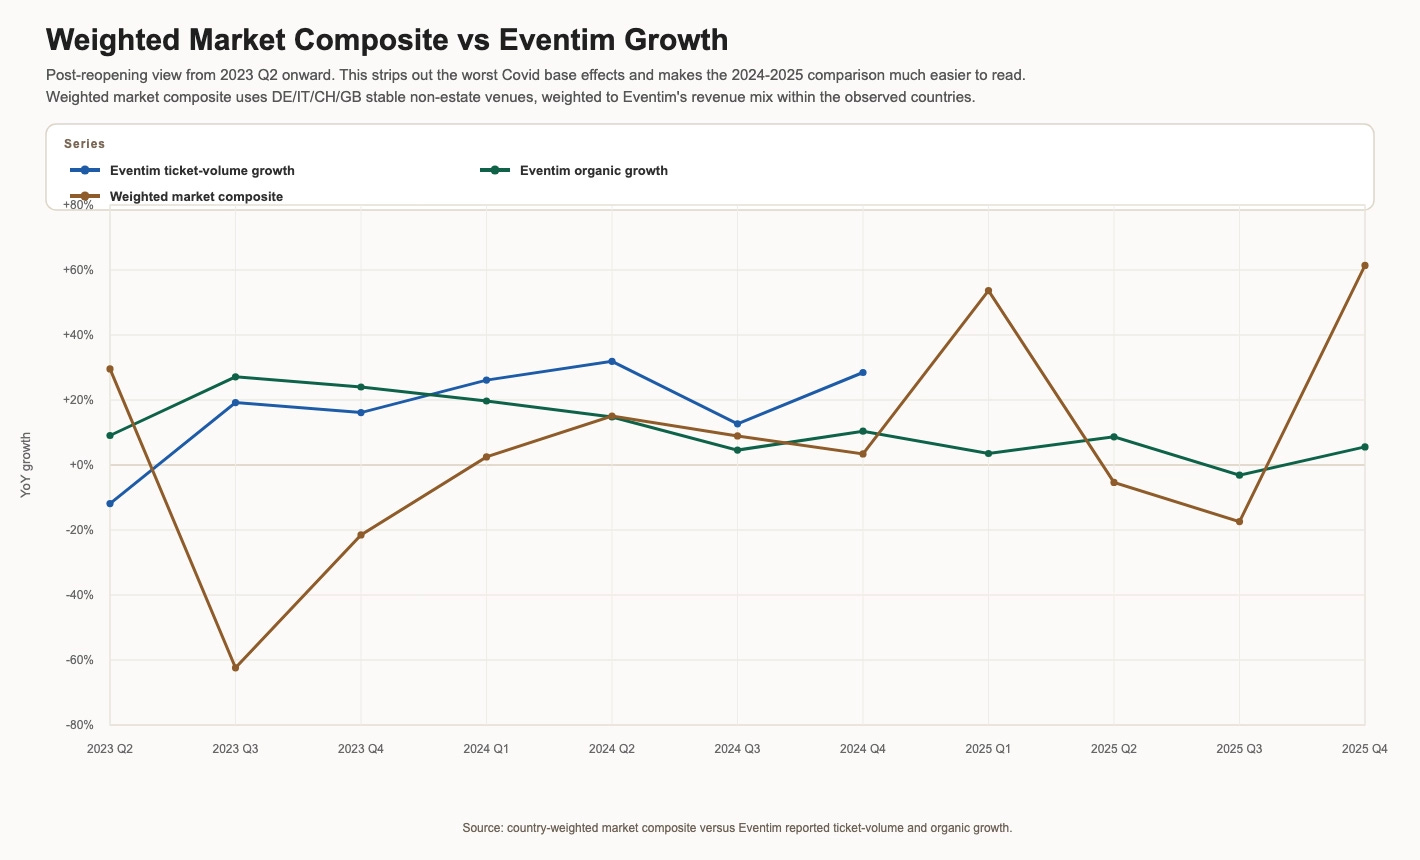
The next thing I tried was to weight the broader market more sensibly to Eventim’s actual business mix. Germany is by far the biggest country for Eventim, then Italy, then Switzerland and Austria, while the UK is much smaller. So I expanded the venue panel and built a country-weighted market series.
That also did not really solve the problem. It improved the fit a bit on the noisy reopening period, but once I focused on the cleaner period from Q2 2023 onward, and especially on a trailing-twelve-month basis, the weighted market still did not behave like Eventim. So the market series remained useful as a denominator or context series, but not as a real Eventim proxy.
That was an important step because it forced me to stop asking “can I make the market look like Eventim?” and instead ask “what is actually different about Eventim?”
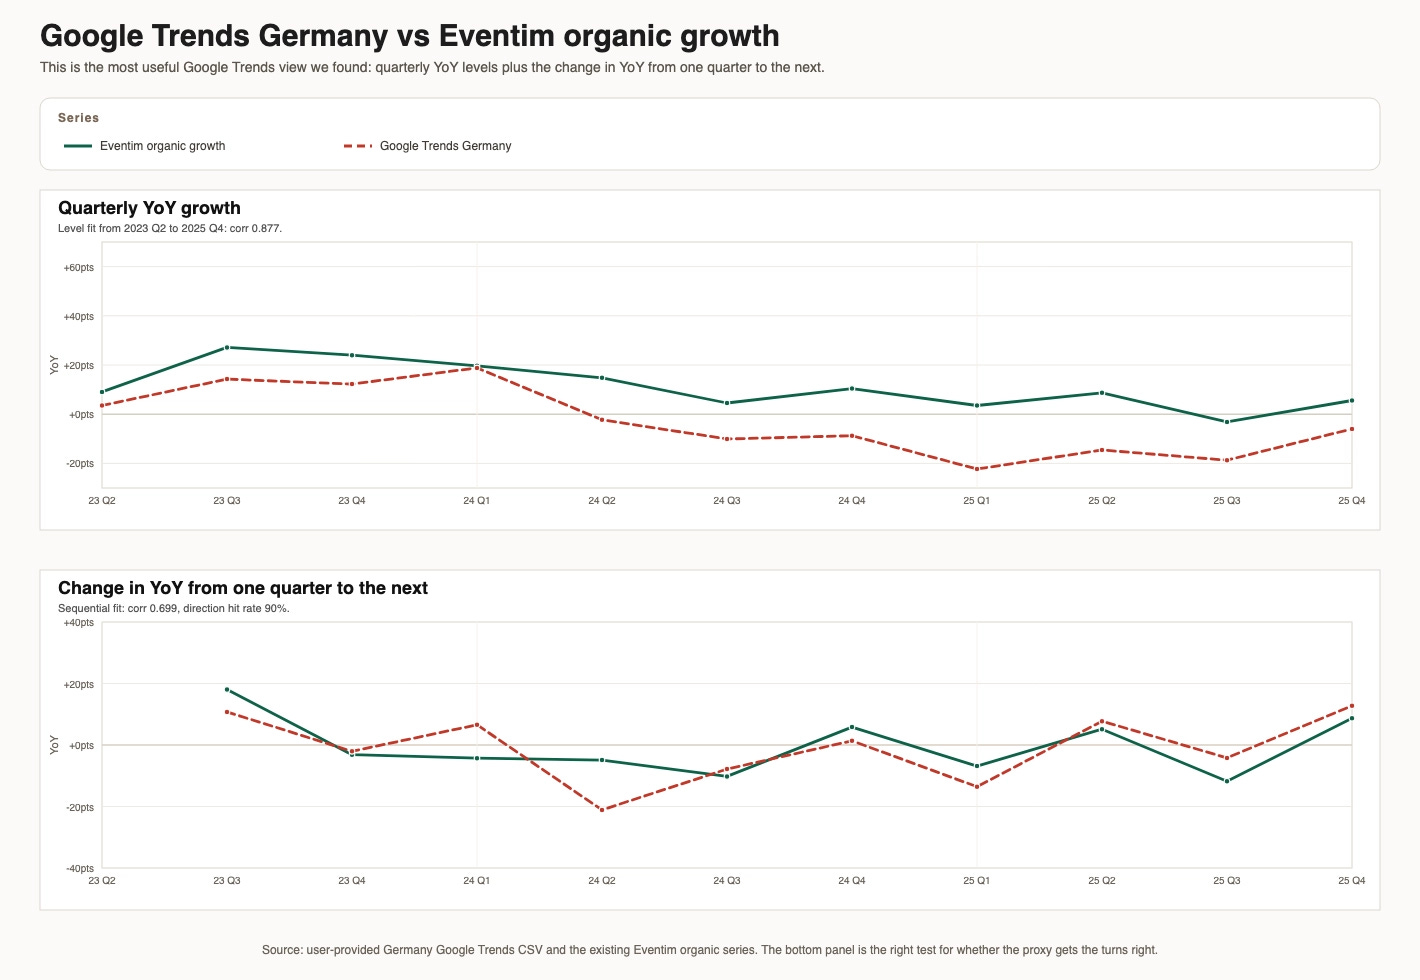
The next experiment was Google Trends. This felt promising because ticketing is a consumer business and people search before they buy. But again, it needed more thought than I expected. The right search term in Germany is eventim, but in Italy it is really ticketone, in Switzerland ticketcorner, and in Austria oeticket. I also suspected that search might lead revenues, because tickets are sold before the event takes place.
This ended up being more useful than I expected, but in a different way from what I first thought. Google Trends was not especially helpful for modelling reported ticket volumes over the long run. But it was much more helpful for understanding the direction of organic growth. In particular, Germany Trends turned out to be one of the better short-term signals for whether organic growth was improving or deteriorating.
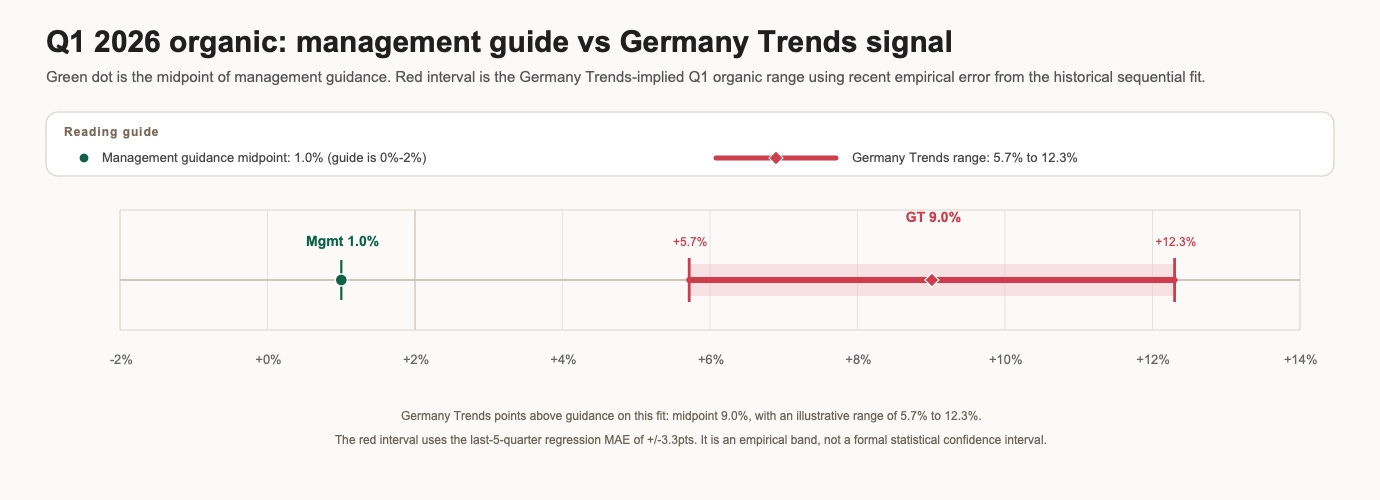
This became an interesting methodological question for Q1 2026. Management guidance suggests muted Q1 growth (I have assumed a 1.0% midpoint). The Germany Trends signal implies a Q1 organic midpoint of around 9.0%, with a wide empirical error band (an illustrative range of 5.7% to 12.3%, derived using the recent empirical error MAE/RMSE of the last 5 quarters). Even the bottom end of that band sits above management's guidance. Whether or not the search signal turns out to be accurate, Q1 will provide a useful real-world test case for how well Google Trends data can anticipate company reporting in the ticketing space. That is ultimately the methodological question this project is trying to answer.
The more important issue long term was still understanding 2025.
At that point I realised I needed to stop looking at scraped event series for a moment and go back to the reported numbers themselves. The key question was whether 2025 looked weak simply because Eventim was lapping a very strong 2024, or whether the business had genuinely lost momentum.
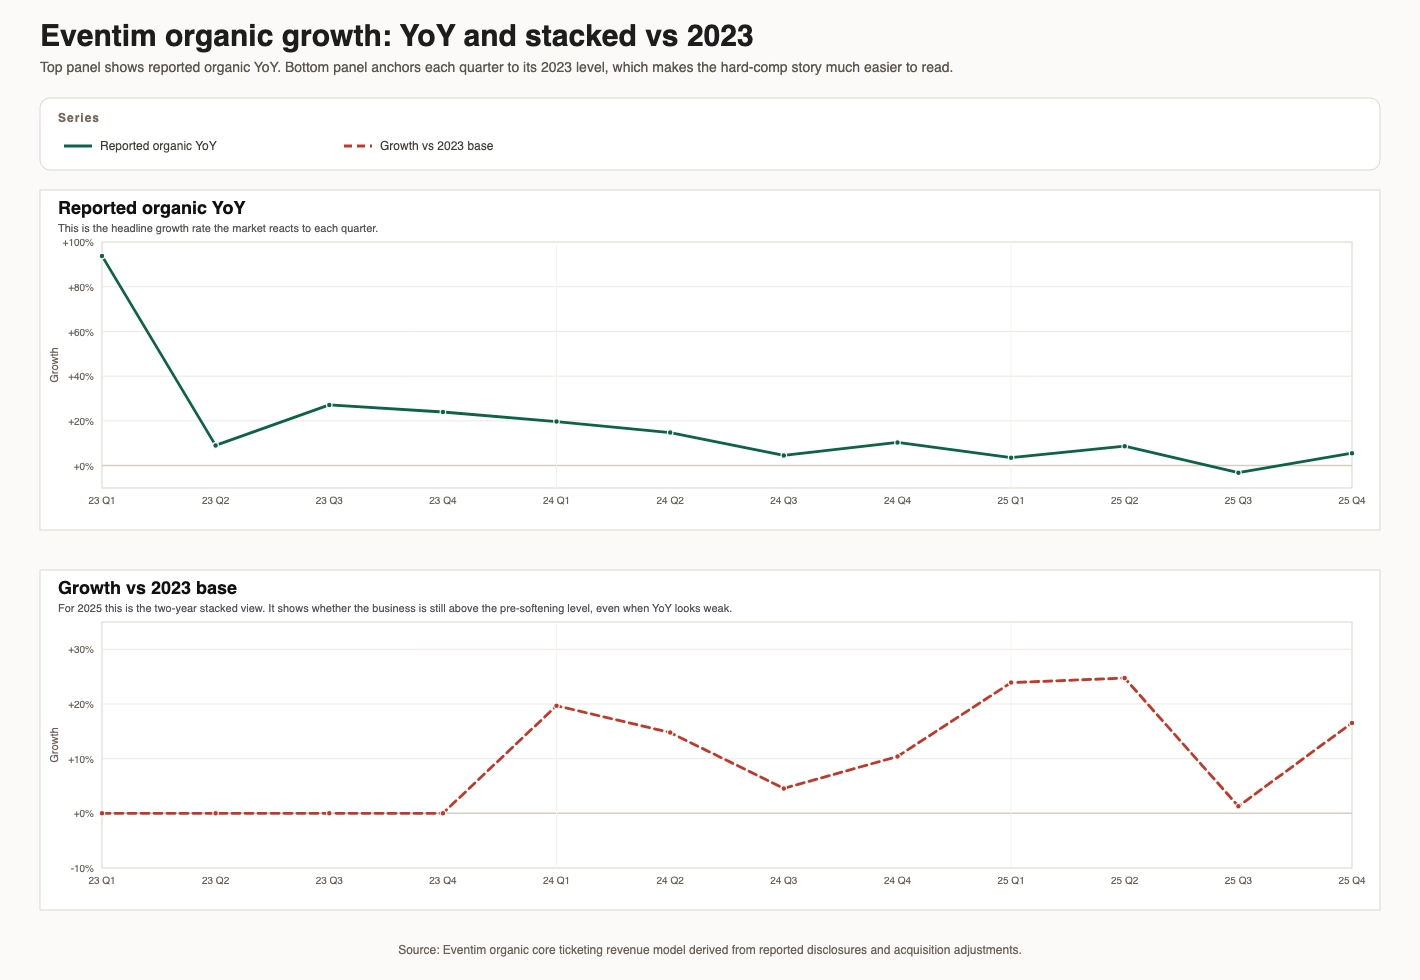
That is where the two-year stack analysis became quite useful. On a simple YoY basis, 2025 looked weak. But against 2023, the picture was more nuanced. Q1 2025 and Q2 2025 were both still strong on a two-year basis, which makes them look much more like hard-comp quarters than true deterioration. Q3 2025 was different. That was the real weak patch. Q4 2025 looked mixed: softer than 2024, but still decent in level terms versus 2023. Although ‘weak comps’ and ‘strong comps’ can get you in a lot of trouble because who decides what the ‘normal’ base year is, that was probably the single most useful sanity check in the whole project, because it showed that 2025 was not just a simple “everything got worse” story. It was more uneven than that.
Once I had done that, the remaining possibilities became much clearer. If the market had not really collapsed, and if hard comps only explained part of the weakness, then the real candidates were things like competition, weaker event mix, lower pricing, weaker fill, or weakness concentrated in a few important markets or venue types.
That is also when I started to understand the limits of the current Eventim-specific dataset. It was good enough to reject simplistic explanations. It was not yet good enough to explain the whole business. So the project moved from “was this just market normalisation?” to “what exactly got weaker inside Eventim, and was that temporary or structural?”
The current evidence leans toward the idea that 2025 was more Eventim-specific than market-wide, and that the weakness was not purely a comp effect. But it still does not fully answer whether the problem was temporary or whether it reflects structural pressure on share, pricing or fill. To answer that properly, I now need a much larger Eventim-specific panel that is tilted to the real economic mix of the business, especially Germany and Italy, rather than a clever but small proxy.
So what does the data actually support?
After going through all of this, I think the data allows me to say a few things with reasonable confidence, and there are a few things it does not resolve.
What the data supports clearly
2025 weakness was not mainly a broad market slowdown. The broad live-events market still looked fairly healthy on the event measures I built.
2025 was not just a comp story, even if tough comps explain part of H1.
The old 4-venue Eventim series is a useful barometer, even if it is clearly not representative of the whole business.
What the data suggests but does not prove
The weakness was probably inside Eventim economics rather than raw event demand. The most likely candidates are share, pricing, fill, or mix.
Germany search trends for Q1 2026 are running notably above management guidance, though the error bands are wide. This will be an interesting real-time test of whether search data can front-run company reporting.
What the data does not resolve
Whether 2025 was just a temporary soft patch or something more lasting.
Whether Eventim actually lost share in a meaningful way.
Whether pricing or fill deteriorated structurally.
So my best summary is this: Eventim’s 2025 slowdown looks more like Eventim-specific weakness inside a still-healthy market than a clean post-Covid end-market normalisation story. That matters analytically, because it shifts the question. The question is no longer really “was the market weak?” The question is “what weakened inside Eventim, and was that temporary or structural?” I do not think the data resolves the full answer to that yet. But it does rule out the simplest explanation, and the Q1 2026 search data adds a useful forward-looking datapoint that will be worth watching as a methodological test case.
Under The Hood
I also used the agent for a few related pieces of analytical work that would typically sit in an equity research workflow: forensic accounting work and some vs Live Nation comparison.
Accounting red flags first, I have a framework I have written into a note and encoded into Primer so I can run them whenever I want.
Run my forensic accounting rules, have the associated numbers in a separate model tab
Clearly the next step was to understand the voucher breakage estimate change and the ticket-related liabilities write-off. Easy work for the agent.
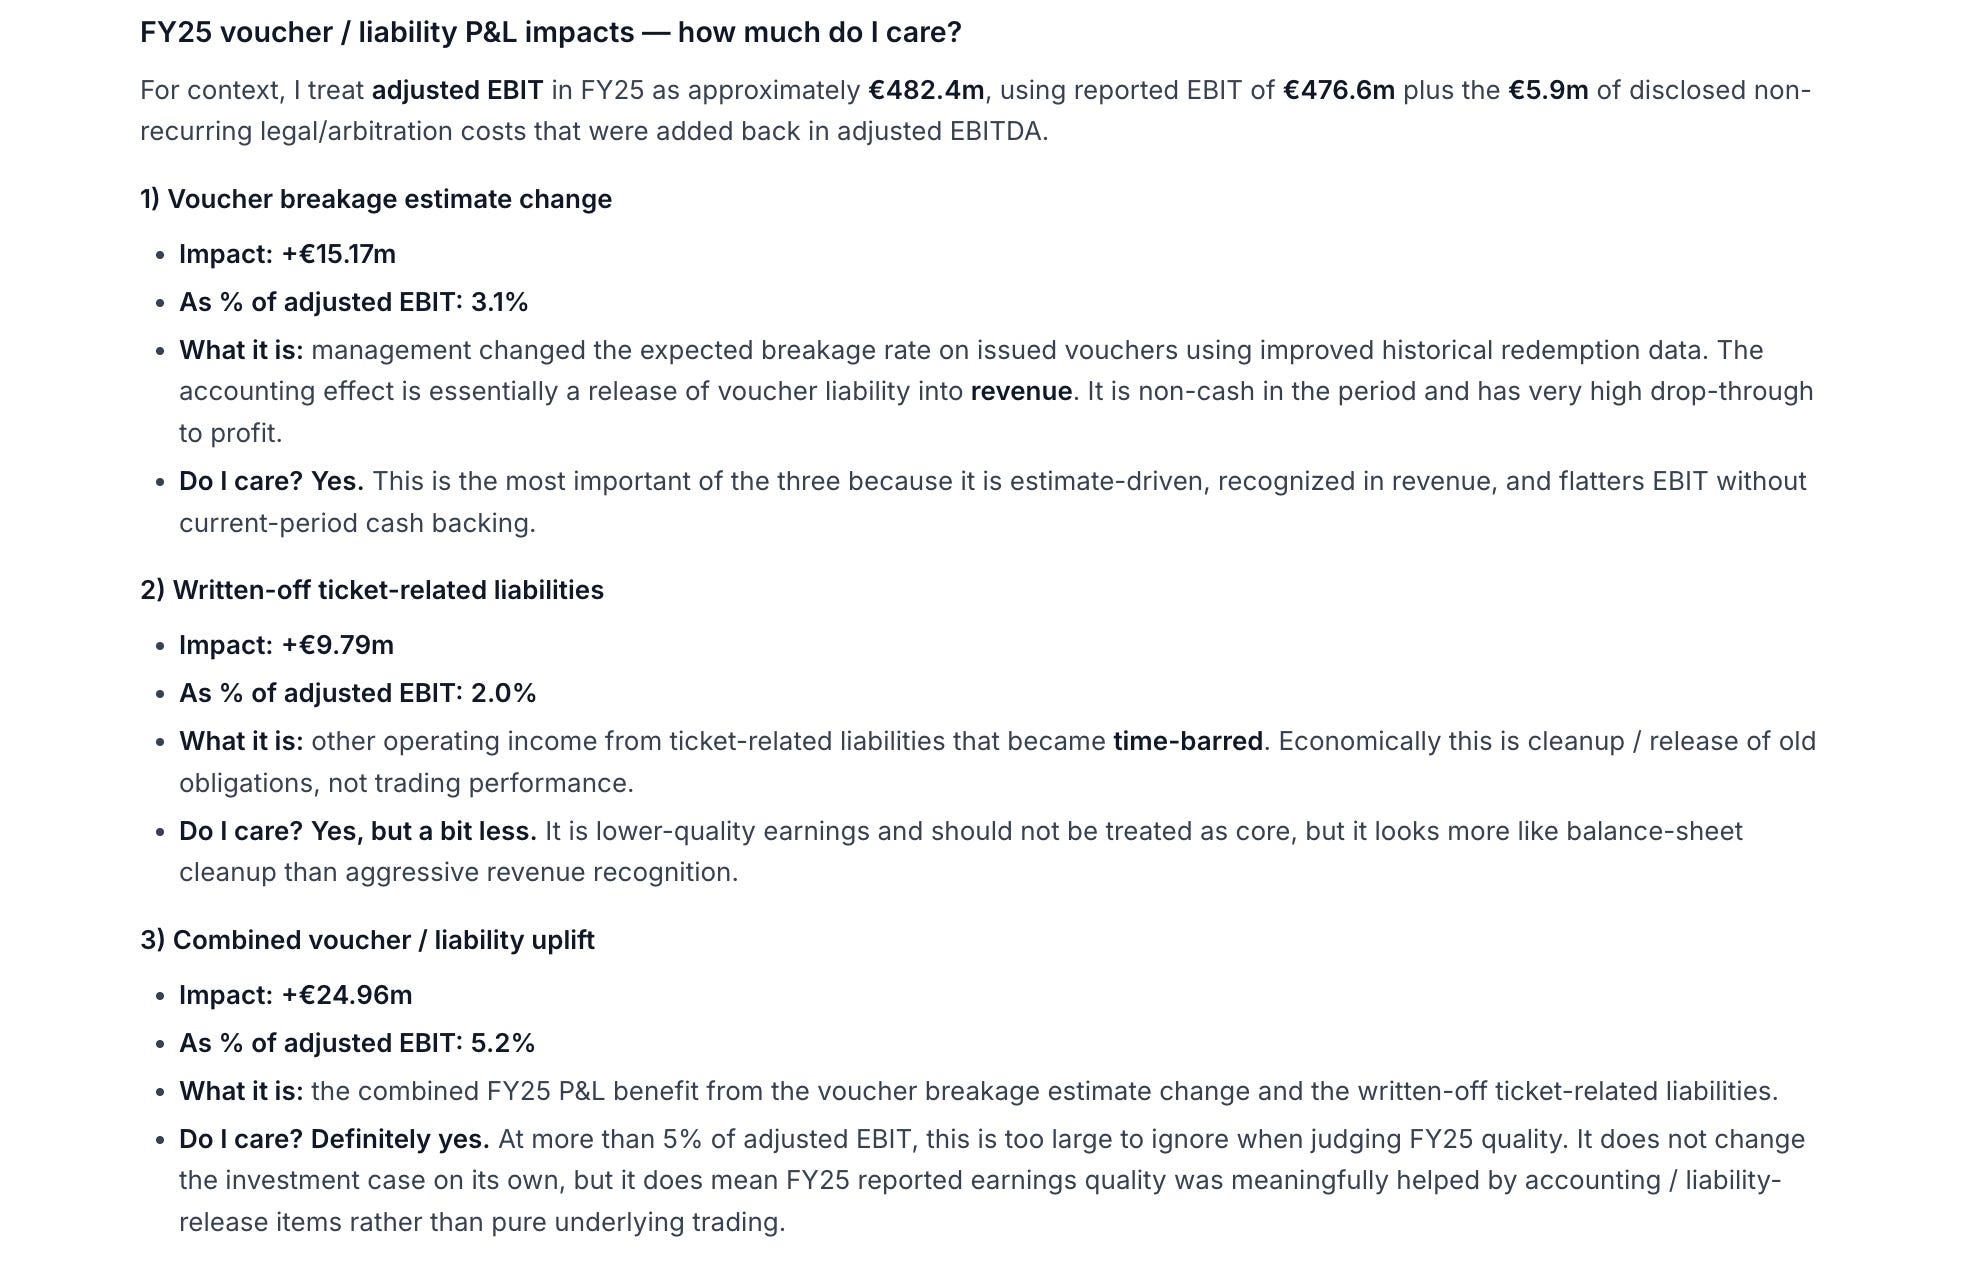
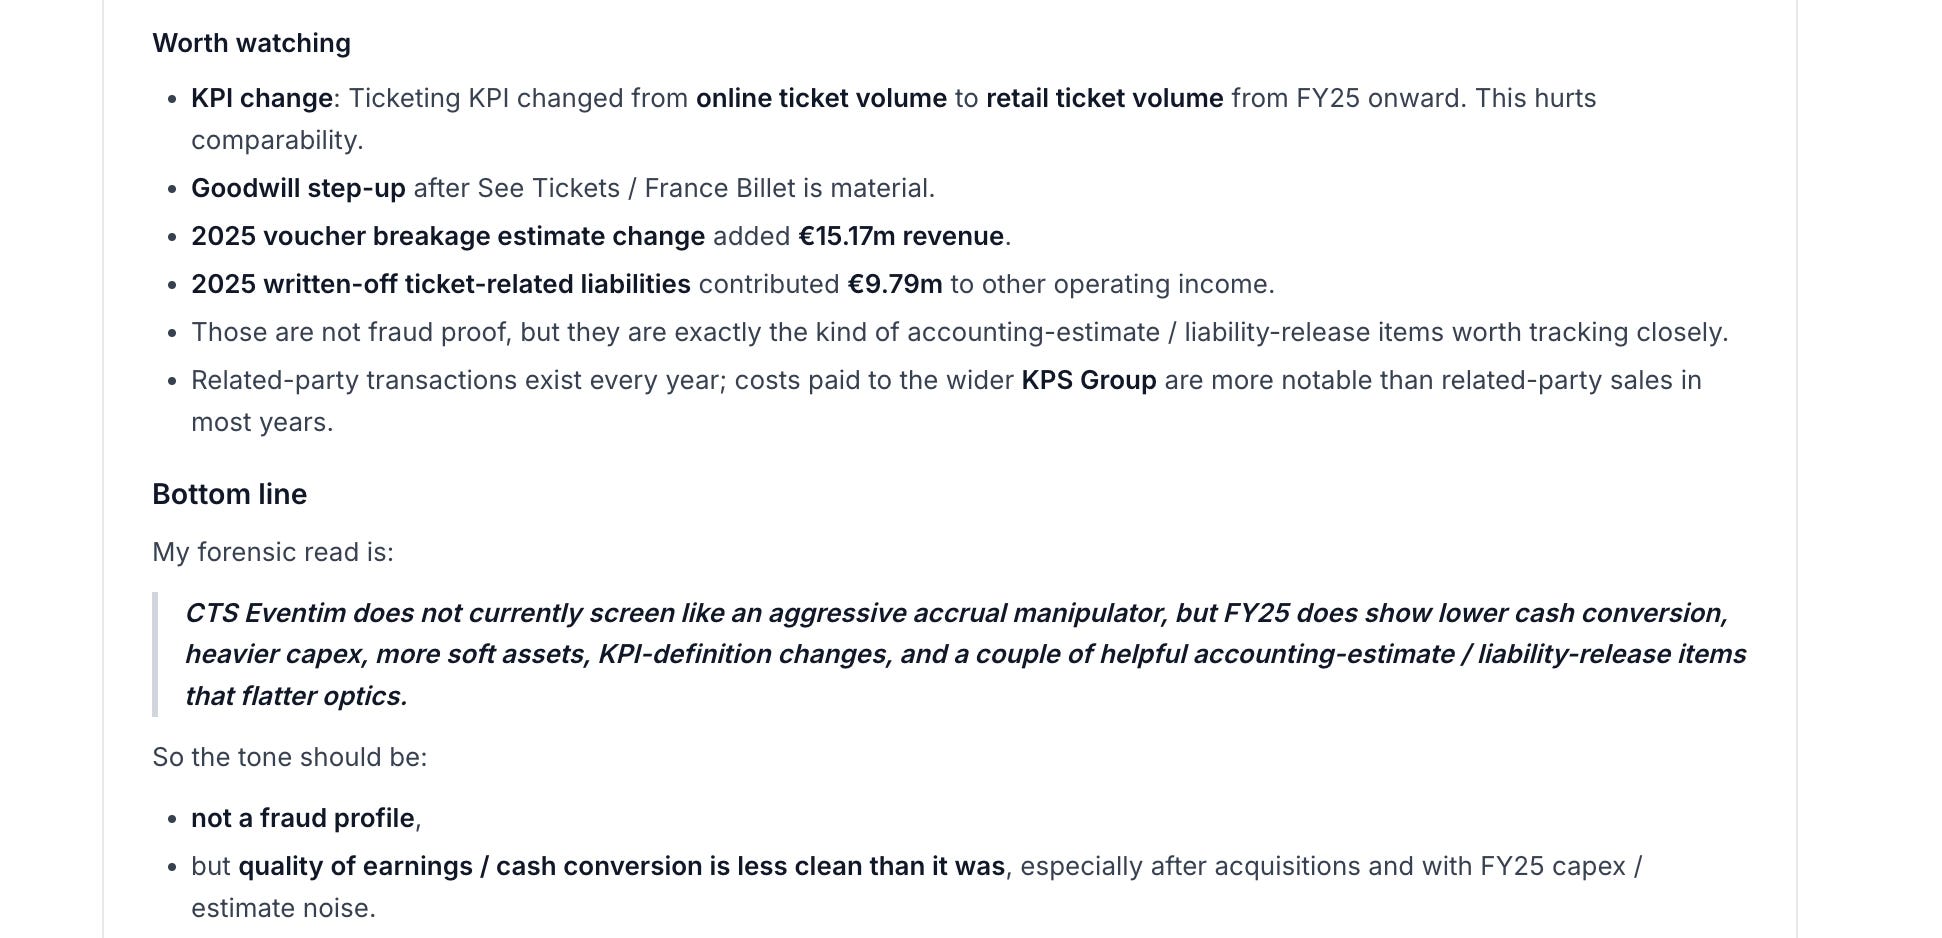
FY25 earnings were helped by a meaningful accounting tailwind from old ticket and voucher liabilities unwinding, rather than purely by underlying trading. The biggest item was a €15.2m revenue benefit from changing the assumed breakage rate on issued vouchers, alongside €9.8m of other operating income from ticket-related liabilities that had become time-barred. Together, that was worth roughly €25m, or just over 5% of EBIT.
This is the kind of finding that would normally take an analyst a full read-through of the annual report to surface. The agent flagged it quickly, which is the main point for our purposes. Analytically, it means reported earnings quality was lower than the headline numbers suggest. The easiest source of this support is now largely exhausted, so a similar-sized boost in FY26 would be unlikely, although smaller write-backs from stale liabilities could still help at the margin.
I’d like you to go through the annual reports with a fine toothed comb to see if there is anything else we should be aware of. Things like mentions of competition as key risks, strange concentration of staff numbers and anything that might be contrary to management speak, focus on the back third of the annual reports and announcements.
Core things highlighted by the agent:
Promoter dependence: This was always in the fine print, but by 2021–22 the annual reports were already explicit that Ticketing depends on promoters continuing to route ticket inventory through the CTS network, making the business less frictionless than the platform narrative suggests.
Competition / antitrust risk: By 2021 it was already clear in the back-end disclosures that competition, consumer-law and antitrust risk were real rather than theoretical, and by 2023–25 the company was still flagging them as medium with ongoing proceedings in Germany, Italy and Switzerland.
Comparability / KPI changes: The numbers became meaningfully harder to compare from 2023 onward, as CTS changed adjusted metrics, reclassified presentation lines, and then in 2024–25 shifted from online ticket volume to the broader retail ticket volume after the See Tickets / France Billet deals.
Balance-sheet complexity: This was always part of the model, but it became much more important from 2023–25 as ticket-money float, advance receipts, voucher liabilities and estimate-heavy balances grew in importance and started to flatter the optics of cash and earnings.
Venue capital intensity: Venue risk became a much more meaningful part of the story from 2023 onward, as ARENA MILANO / Unipol Dome moved from strategic talking point to a real source of capex, guarantees, balance-sheet complexity and ramp-up risk.
Earnings quality: Earnings quality clearly softened in 2024–25, when acquisitions, one-offs, liability write-backs and voucher accounting tailwinds became much more visible in reported profit than they had been in the earlier, cleaner ticketing-led story.
How the CTS Eventim story changed over time
CTS Eventim has gradually changed shape. In 2021–22, it still looked like a fairly clean ticketing-led compounder. In 2023, one-offs and adjusted metrics started to muddy the picture. In 2024, acquisitions like See Tickets and France Billet made growth more perimeter-driven and less comparable. By 2025, the business looked meaningfully more complex: more dependent on partners and promoters, more exposed to venue capital intensity, more reliant on acquisitions and integration, and more flattered by accounting tailwinds. The result is that CTS should no longer be thought of as a simple premium ticketing platform, but as a broader and messier ecosystem story.
Management Incentivisation
Added complexity, changing KPIs and lower earnings quality are usually things that reward shorter term management incentives so given I could do full remuneration analysis in 5 minutes, I thought I should.
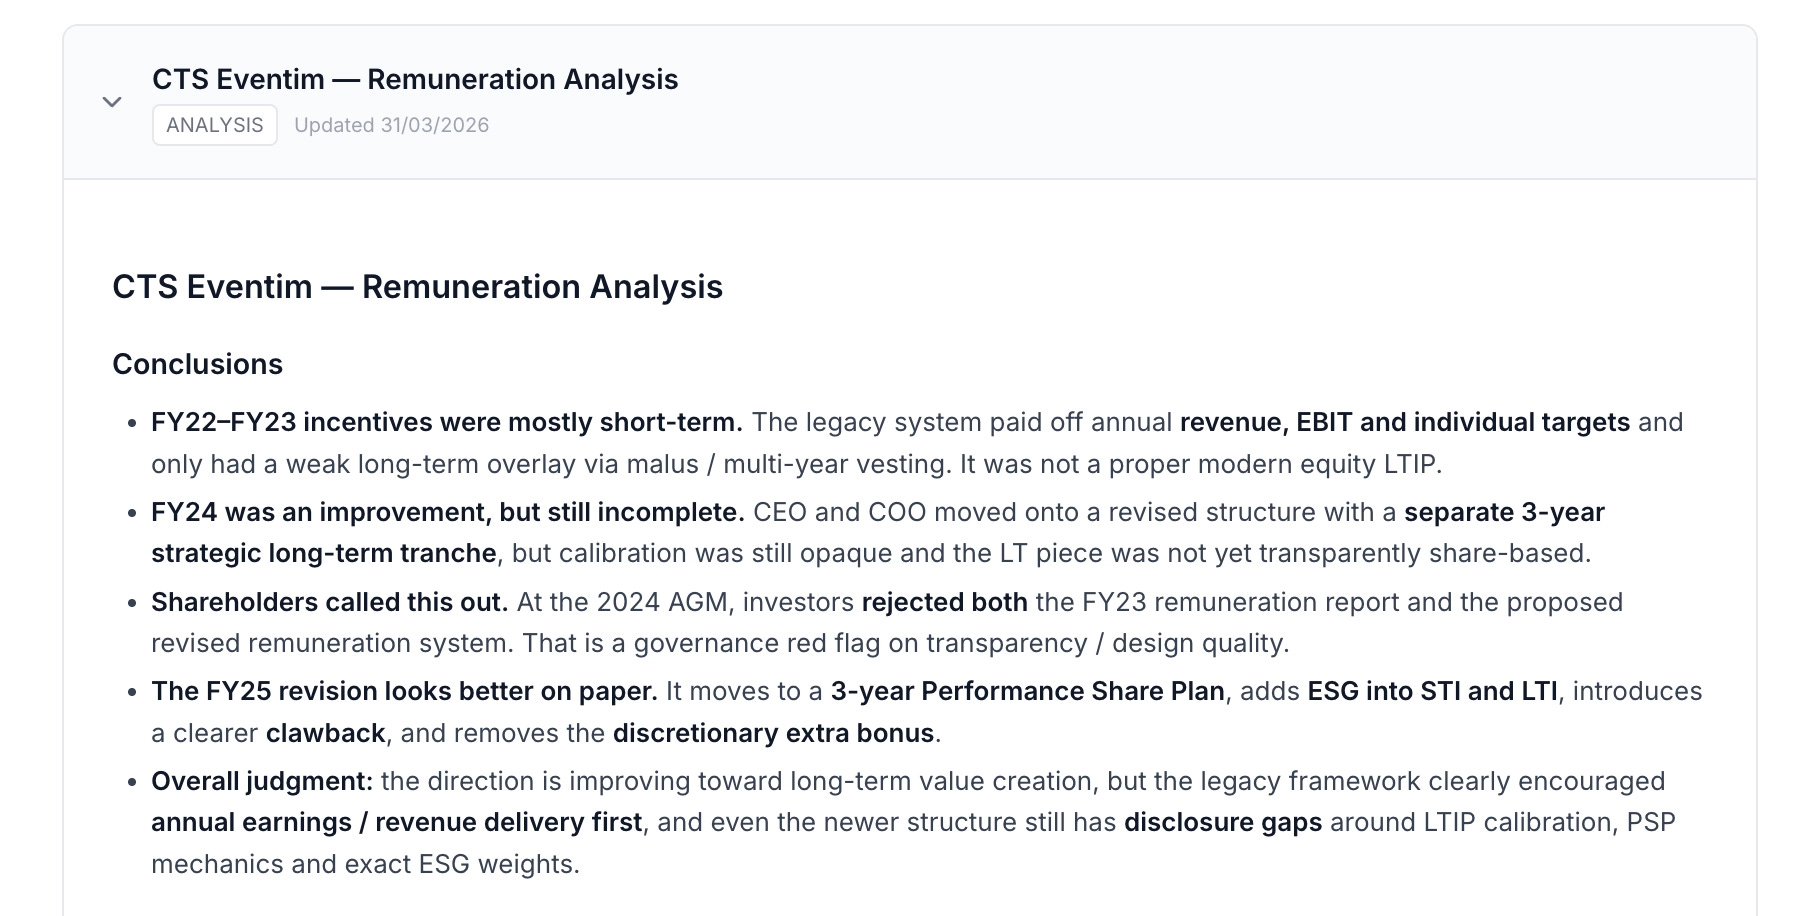
Historically, Eventim’s pay structure looked more short-term than long-term. Management was mainly incentivised on annual revenue, EBIT and individual goals, with only a weak long-term overlay, so the scheme rewarded delivering near-term numbers more than long-term per-share value creation. That matters more given the group’s growing complexity and use of adjusted metrics.
The framework is improving, with FY24 introducing a three-year strategic long-term tranche, and the latest system moving further in the right direction with a performance share plan and clawback provisions. But disclosure is still patchy, and shareholders clearly were not fully convinced: in 2024 they voted down both the remuneration report and the proposed new system.
The direction of travel on remuneration looks positive. Unless the structure is diabolical, though, it is hard to point to it as a smoking gun on its own.
Competitive Analysis
Wanted to quickly check margins vs Live Nation. Usually this is at least a few hours job given accounting and business differences but I just threw it to the agent to get going.
I want to compare EBIT profitability in the ticketing businesses of CTS eventim and Live Nation.
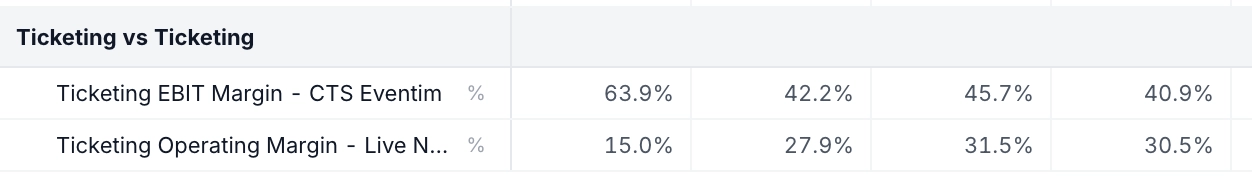
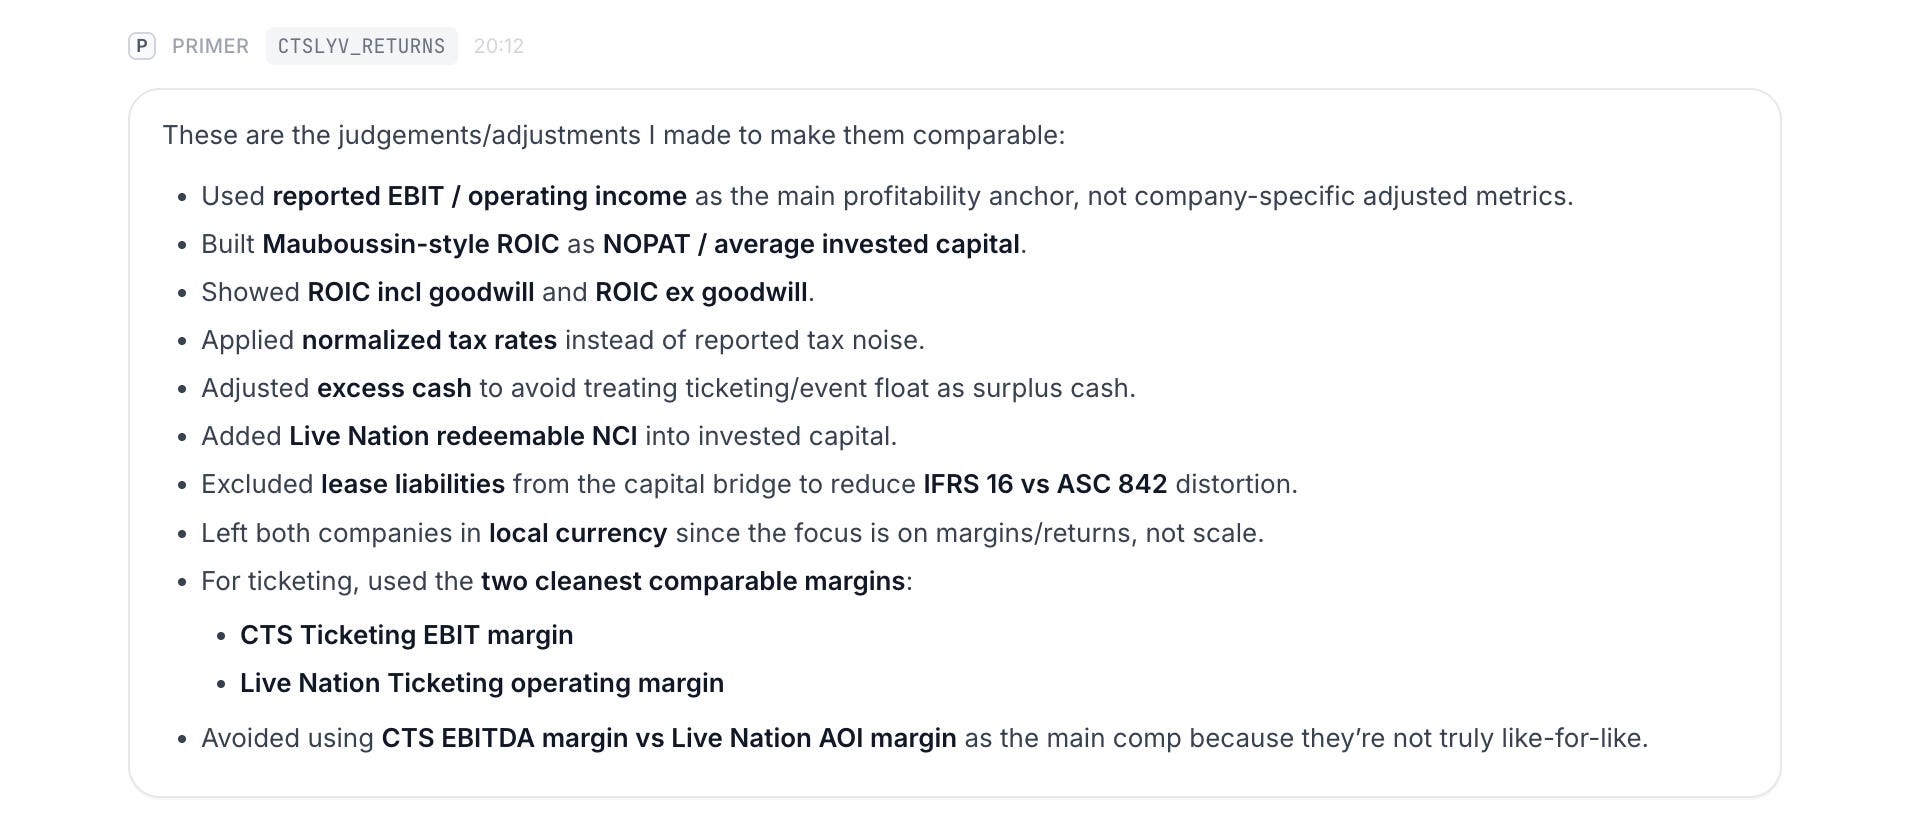
Even after adjusting for accounting differences, customer float, goodwill, and lease treatment, CTS consistently earns higher EBIT margins and materially higher ROIC than Live Nation. Even on the cleaner ticketing-only comparison, CTS still comes out ahead on these metrics. This comparison was primarily a test of whether AI tools could reconcile two very different sets of accounts into a comparable framework, the fact that it surfaced a clear and persistent margin difference in a matter of minutes, rather than the hours it would normally take, is the main point.

Disclaimer: This article is for informational and educational purposes only and serves as a demonstration of data analysis and AI workflows. It does not constitute financial advice, an investment recommendation, or a solicitation to buy or sell any securities. No part of this article should be construed as a recommendation to buy, sell, or hold any security, or as an opinion on the valuation of CTS Eventim. I am not a registered investment professional. Please do your own due diligence or consult a professional financial advisor before making any investment decisions. I hold no position in CTS Eventim or related securities and have no intention of taking one.